Penalty totals and percentages
One of the stats we track with a lot of detail is penalties. This post will break those down a little bit and provide some more detail than just player and minutes and look at penalty totals and percentages.
First, we’ll take a look at the overall numbers. This chart shows how many penalties each player has taken. This number is every penalty (minors, majors, misconducts) and any double-minor is counted as 2 penalties.
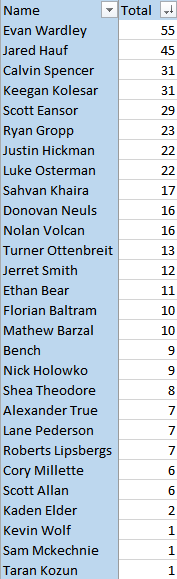
Total number of penalties
For the season, Seattle had 427 total penalties. I don’t think anyone is shocked that Evan Wardley leads the list. Jared Hauf being 2nd, however, is a little surprising. All the bench minors were for too many men on the ice.
Next chart shows how many penalties resulted in a power play for the opponent and the percentage of total penalties the resulted in a power play for the opponent.
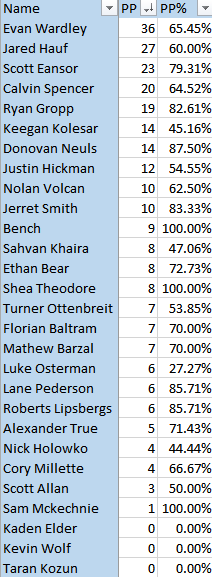
# of power plays and % of total penalties
Seattle was short-handed 274 times for the season. That was 64.17% of the 427 total penalties that resulted in a power play. (The WHL site has it at 275 but there is an uncorrected error on a scoresheet that erroneously gave a power play to each team.)
What the chart shows is that when Shea Theodore takes a penalty, he’s not taking anyone else with him. So that means no matching roughing penalties or fighting majors. Contrast that with someone like Luke Osterman who only has 27.27% of his penalties resulting in an opposition power play. If Osterman is headed to the box, he’s not going to be lonely.
What also jumps out is that, even though Evan Wardley had the most penalties and most penalties resulting in opposition power plays, he’s not even top-10 percentage wise in penalties that lead to power plays for the opponents. So, he takes a lot of penalties but, as a percentage, he’s not leaving his team as shorthanded as some other players.
This last chart shows how many power play goals were scored on a penalty taken by the listed player. The percentages listed indicate what percentage of total penalties the power play goals represent and what percentage of penalties that result in a power play those goals represent.
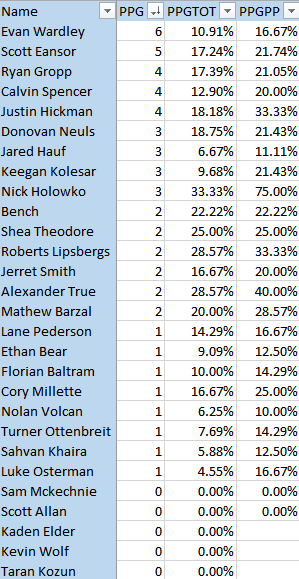
Power play goals, goals as % of total penalties, goals % of penalties resulting in power plays
Seattle gave up 55 power play goals. That is 12.88% of the total 427 penalties and 20.07% of the 274 penalties that resulted in a power play opportunity for the opponent.
If you are looking at raw numbers, again Evan Wardley is the leader. That is to be expected based on how many penalties he had. But then look at the percentages. Nick Holowko took only 9 penalties all season, 4 of which resulted in a power play. But 3 of those 4 lead to power play goals, a 75% conversion rate. He’s one of 6 players (including the bench) where 20%+ of their total penalties resulted in a goal and one of 15 players where 20%+ of their penalties that lead to a power play were scored on.
On the flip side, Nolan Volcan and Jared Hauf are the two top players in terms of their penalties not causing a goal against. Only 6.25% of Volcan’s 16 total penalties resulted in a goal. Jared Hauf, who we saw above was #2 for total penalties, only has 3 of his 45 total penalties scored on, a 6.67% result.
One final list now. It’s the most common penalty called for each player. We’ll list these in alphabetical order by last name and number of instances called
Scott Allan Fighting 2
Florian Baltram Hooking/Roughing 3 each
Mathew Barzal Slashing 3
Ethan Bear Tripping 3
Bench Too Many Men 9
Scott Eansor Slashing/Tripping 5 each
Kaden Elder Fighting/Misconduct 1 each
Ryan Gropp High Sticking 5
Jared Hauf Interference 8
Justin Hickman Roughing 10
Nick Holowko Fighting 3
Sahvan Khaira Roughing 5
Keegan Kolesar Fighting 9
Taran Kozun Unsportsmanlike Conduct 1
Roberts Lipsbergs High Sticking/Slashing 2 each
Sam Mckechnie Tripping 1
Cory Millette Cross Checking/Hooking/Misconduct/Roughing/Tripping/Unsportsmanlike Conduct 1 each
Donovan Neuls Tripping 3
Luke Osterman Fighting 12
Turner Ottenbreit Interference 3
Lane Pederson Hooking 2
Jerret Smith Tripping 4
Calvin Spencer Fighting 6
Shea Theodore High Sticking 2
Alexander True High Sticking 2
Nolan Volcan Roughing 3
Evan Wardley Roughing 13
Kevin Wolf Fighting 1
No comments yet.